
Revenue Cycle Analytics & Reporting
Turn Billing Data Into Clear Revenue Insights
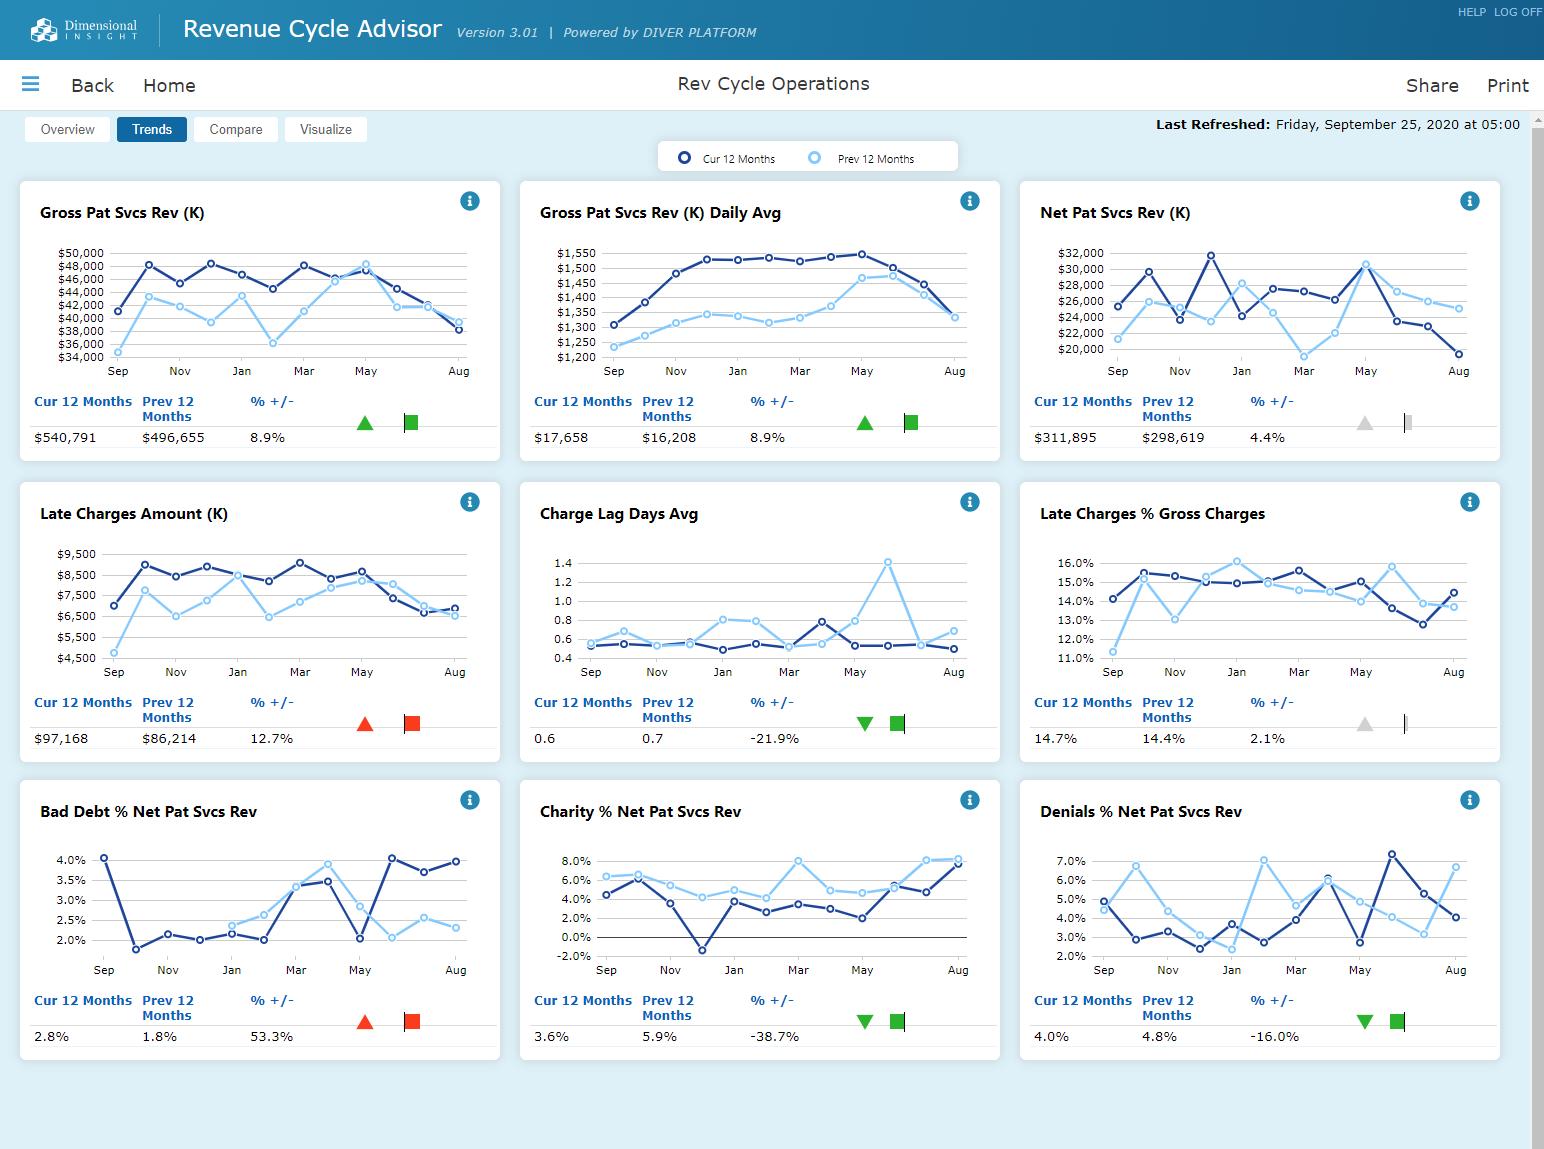
CoMed gives practices better visibility into collections, denials, A/R aging, payer performance, and provider productivity through data-driven reporting and dashboard-style insights.
- KPI reporting
- Payer performance insights
- Denial and A/R trend visibility
NCR
Net Collection Rate
A/R
Aging Trends
Denials
Trend Analysis
Payer
Performance View
What’s Included in Analytics & Reporting
CoMed’s analytics approach helps practices understand what is happening in the revenue cycle, where money is delayed, and which metrics need attention.
Revenue KPI Scorecards
Track key revenue cycle indicators including net collection rate, clean claim rate, denial rate, and days in A/R.
A/R Aging Reports
Monitor outstanding balances by aging bucket, payer, provider, and claim status.
Denial Analytics
Identify top denial categories, payer patterns, appeal status, and preventable issues.
Payer Performance Reporting
Compare payer reimbursement timelines, denial rates, and collection behavior.
Analytics Dashboard Focus
- Net collection rate tracking
- A/R aging visibility
- Denial trend reporting
- Provider and payer performance
Want better revenue visibility?
Dashboard Reporting Workflow
- Collect billing and claims performance data
- Organize KPIs by payer, provider, specialty, and location
- Identify trends in denials, A/R, collections, and reimbursement
- Highlight revenue leakage and operational bottlenecks
- Prepare monthly dashboard summaries and performance insights
- Use reports to guide action plans and follow-up priorities
Dashboard Views Built for Decision-Making
Use visual reporting to quickly understand performance, prioritize follow-up, and improve financial outcomes.
Provider Productivity
Compare visits, charges, collections, and reimbursement by provider.
Payer Mix Insights
See how payer groups affect payment speed, denials, and collection performance.
Monthly Trend Reports
Track performance month over month to identify improvement or revenue risk.

Know Exactly Where Revenue Is Delayed
Analytics helps uncover issues that are often hidden inside billing workflows. CoMed turns your data into actionable insights your leadership team can use.
- Collections and reimbursement trends
- High-risk aging buckets
- Top payer denial patterns
- Underpayment and appeal visibility
- Provider-level performance reporting
Ready to See Your Revenue Cycle More Clearly?
Talk with CoMed about analytics and reporting designed to improve financial visibility, follow-up, and revenue performance.